
Command Centers
Welcome To Soham Impex
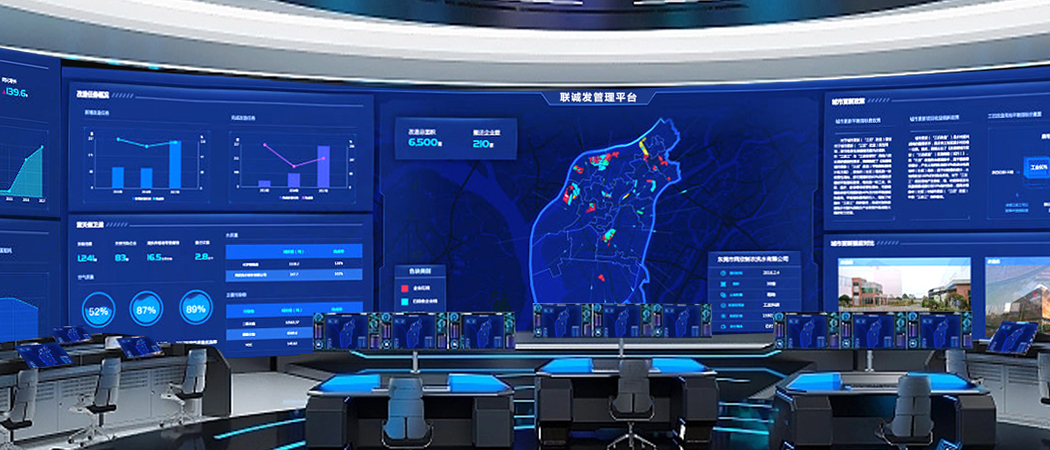
Active LED displays are critical for providing real-time data, situational awareness, and streamlined communication for decision-makers. The content displayed needs to be clear, actionable, and organized to support quick analysis and responses. Below are content ideas for LED displays in various types of command centers:
1. Real-Time Data and Monitoring
Live Data Feeds: Show data from critical systems like traffic, network status, energy grids, or security cameras. The data should update in real-time and include color-coded status indicators (e.g., green for normal, red for critical).
Incident Tracking: Display active incidents, their locations, and current response statuses. Include information like response times, severity levels, and resources deployed.
KPIs and Metrics: Highlight key performance indicators relevant to the mission, such as response time, operational efficiency, uptime, or service levels.
2. Operational Dashboards
System Health Monitoring: Provide live system health dashboards, covering servers, networks, and software with alerts for any outages or issues.
Resource Management: Show resource availability like personnel, equipment, or vehicles, ensuring the team knows what’s in use and what’s available.
Process Tracking: Display the current status of ongoing processes like production lines in manufacturing command centers or system checks in IT centers.
3. Maps and Geospatial Data
Live GIS (Geospatial Information Systems) Maps: Show dynamic maps of key areas, highlighting things like transportation routes, assets, or points of interest.
Weather and Environment: Integrate live weather feeds, natural disaster warnings, or environmental conditions that can impact operations.
Satellite or Aerial Imagery: Display live or regularly updated satellite views for situational awareness in military or emergency response command centers.
4. Communications and Alerts
Emergency Alerts: Use prominent portions of the display for urgent alerts, emergency broadcasts, or system-wide announcements.
Message Boards: Display important communications between teams or departments, keeping everyone updated on the latest information.
Call Center or Communication Channels: Show current call statuses, open lines, or communication flow between various teams.
5. Live Video Feeds
Surveillance Cameras: Show live camera feeds from security, traffic, or operational zones.
Drone or UAV Feeds: For security or military operations, show live video from unmanned vehicles or drones operating in the field.
Conference Calls or Team Briefings: Use screens for live video conferences or team briefings, allowing key personnel to share updates.
6. Situational Awareness Displays
Incident Timelines: Display incident timelines, showing key events, milestones, and expected next actions.
Task Management: Highlight the status of tasks assigned to teams, including deadlines, progress bars, and resource allocation.
Operational Priorities: Display a dynamic list of top priorities based on real-time data or leadership input.
7. Cybersecurity Monitoring (For IT Command Centers)
Threat Detection Systems: Real-time updates on cybersecurity threats, including potential breaches, malware activity, and unusual network behavior.
Firewall and Network Status: Display the health of firewalls, network bandwidth, and intrusions.
Attack Maps: Visualize the origin and destination of network attacks or suspicious activities across the globe.
8. Traffic and Transportation Management (For Traffic Command Centers)
Traffic Flow and Congestion Data: Real-time visuals of traffic flow, congestion hot spots, and road closures.
Public Transportation Monitoring: Track live status of public transportation services such as buses, trains, and subways.
Accident and Emergency Updates: Instant updates on accidents, road repairs, or hazardous conditions.
9. Energy or Utility Grids
Grid Status and Load Balancing: Show real-time energy consumption data, supply levels, and load distribution across grids.
Outage Reports: Display reports of outages, affected areas, and estimated resolution times.
Resource Allocation: Track fuel, water, or power supply and distribution, including reservoir levels and pipeline conditions.
10. Decision Support and Analytics
Predictive Analytics: Show forecasts and predictions for system failures, traffic patterns, or resource demand based on current data.
Trend Analysis: Provide visualized trends over time to help in decision-making (e.g., increasing network traffic, energy usage spikes).
Simulations and Modeling: Use part of the screen to display real-time simulations or models based on “what-if” scenarios to guide decisions.
11. Emergency Response Coordination
Command Chain Overview: Show the hierarchy of command, including who is leading the response for particular incidents.
Emergency Protocols: Display checklists or step-by-step protocols for handling

Products
Agency
Get In Touch
- Rajkot Gujarat India.
- +91 9974 601 712
- info@sohamimpex.co.in
Follow Us
Soham Impex has successfully built a presence in the Active LED Display for Advertising and Branding Purposes. We stand out with the help of our comprehensive LED design and build, catered to clients Pan-India.
Follow Us
Get In Touch
- +91 9824201712
- info@sohamimpex.co.in
- 150ft. Ring Road, Rajkot Gujarat India.